Welcome to AG Intelligence! This guide will walk you through how to use your analytics dashboard to track your music's performance and understand how your events impact your artists’ streaming numbers.
FIRST THINGS FIRST:
How to Set Up Your Artist with a Chartmetric ID and/or Spotify ID
There are two ways to add Spotify IDs to your artists in AG Intelligence.
Option 1: Add Multiple IDs at Once (Recommended for Rosters)
- Navigate to AG Intelligence.
- Look for the orange banner at the top of the page: "X of your artists are missing a Spotify ID. Add Spotify IDs to unlock streaming data."
- Click Add Spotify IDs on the right side of the banner.
- Enter multiple IDs at once to quickly connect your entire roster.
Option 2: Add an ID to a Specific Artist
- Navigate to the artist you'd like to connect.
- Click into Artist Settings, then select External IDs.
- Enter the ID and click Save.
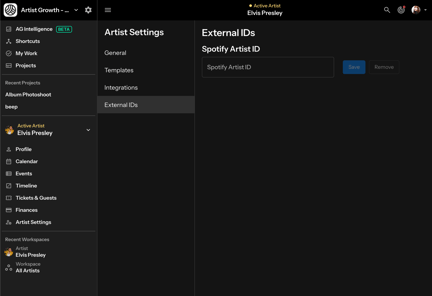
Note: This method connects one artist at a time.
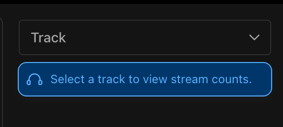
Select a Track to Analyze
Once you've set your timeframe, it's time to choose which track you want to see analytics for. AG Intelligence gives you three convenient ways to find your track:
Search Methods:
- Scroll through the list - Browse through all available tracks by scrolling
- Type the track name - Use the search box to quickly find a track by entering its title
- Enter the ISRC number - Search using the International Standard Recording Code for precise track identification
Pick the method that works best for you and select your desired track.
Choose Your Focus Date
Start by selecting a specific event/date that best matches the insights you're looking for.
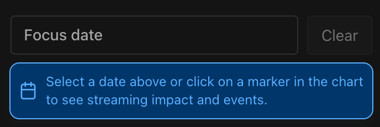
Choose the timeframe that best matches the insights you're looking for.
Filter by Event Type
Now you can refine your view by selecting which types of events you want to see alongside your track's streaming data. This helps you understand how different activities impact your numbers.
Available Event Types:
- Performance
- Festival
- Promotion
- Marketing
- Special event
- Rehearsal
- Travel
- Miscellaneous
- Hold
- Digital
- Creative
- Session
- Publicity
- Release
- Content
- Commercial
- Brand
- Google calendar
Choose one or multiple event types at the top of your dashboard to filter the events displayed on your chart.
Select Country & Market
Narrow down your data by geographic location to see how your track performs in different regions.
How to Filter:
- Check off multiple countries to include in your analysis
- Use market filters to narrow down your selections
- Combine country and market filters to get highly specific insights
This helps you identify which regions are responding best to your music and promotional efforts.
Filter by Streaming Service
Once you click on a specific track, you can further refine your chart view by selecting which streaming platforms you want to analyze.
Note: You can only do one at a time & you can choose which service you'd
like to view after selecting your track.
Available Services:
- Spotify
- YouTube
- Shazam
- SoundCloud
Filter by one or multiple services to compare platform performance independently.
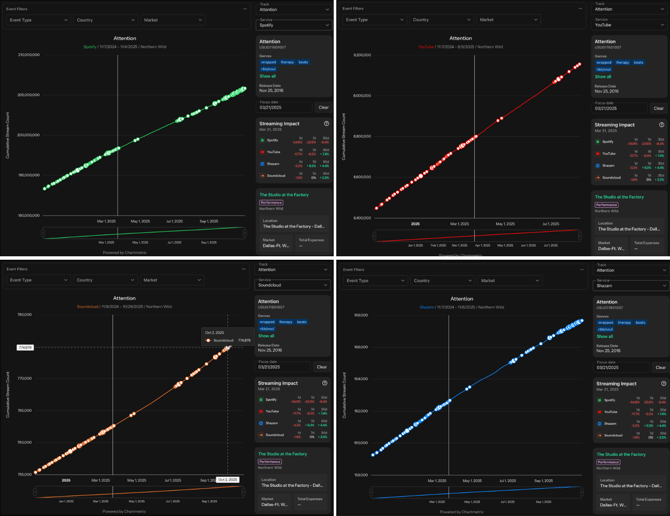
Understand Event Markers on Your Chart
The dots you see on your chart are called "markers" and they represent events from your calendar. These markers are powerful tools for understanding cause and effect.
What Markers Show:
When you hover over a marker (event dot) on the chart. This information includes:
- The event name
- Event date
- Event cost
- The market where the event took place
- Associated streaming numbers
Analyzing Impact:
Use these markers to streamline your analysis and answer important questions:
- Where were your streams before a particular event?
- How did the event affect your streaming numbers?
- Did the event help increase your numbers, or not?
- What can you do differently next time?
- What strategies should you repeat?
By connecting your events to streaming data, you can make informed decisions about which promotional activities deliver the best results.
Navigate and Zoom Your Chart
AG Intelligence provides multiple ways to zoom in and out of your charts for detailed analysis.
Zoom Methods:
Using a Mouse
Simply use your mouse scroller to zoom in and out of the chart.
Using a Laptop Trackpad
Place two fingers on your trackpad and move them apart to zoom in, or pinch them together to zoom out.
Using the Zoom Scroll Feature
Below your graph, you'll find a zoom scroll bar that gives you precise control:
- Click and drag to the right - Move the viewing window forward in time
- Click and drag to the left - Move the viewing window backward in time
- Adjust the toggles - Drag either end of the zoom bar to narrow or expand your time window
Example: Want to focus only on July through September? Simply drag the toggles to isolate just those three months for a targeted view of your summer performance.
Quick Tips for Success
- Start with broader filters and gradually narrow down to identify patterns
- Compare different timeframes to spot trends and growth opportunities
- Pay close attention to markers around major events to measure their impact
- Use multiple country filters to identify your strongest markets
- Zoom in on specific date ranges around releases or campaigns for detailed insights
Ready to dive in?